In This Article
Overview
The insights dashboard is your one-stop view for understanding business performance at a glance. Designed to help service professionals track, analyze, and act on key metrics, this dashboard simplifies decision-making—so you can run a more efficient and profitable business.
The insights dashboard is available on all plans. View our current pricing plans.
To check what plan you’re on, navigate to the Gear Icon > Account and Billing. If you have any questions about your plan’s features or pricing, our support team is here to help!
To view the insights dashboard, select Insights from the side navigation. The insights dashboard is accessible to users with permissions to view reports, however what appears on the dashboard will be determined by the rest of the user’s permissions.
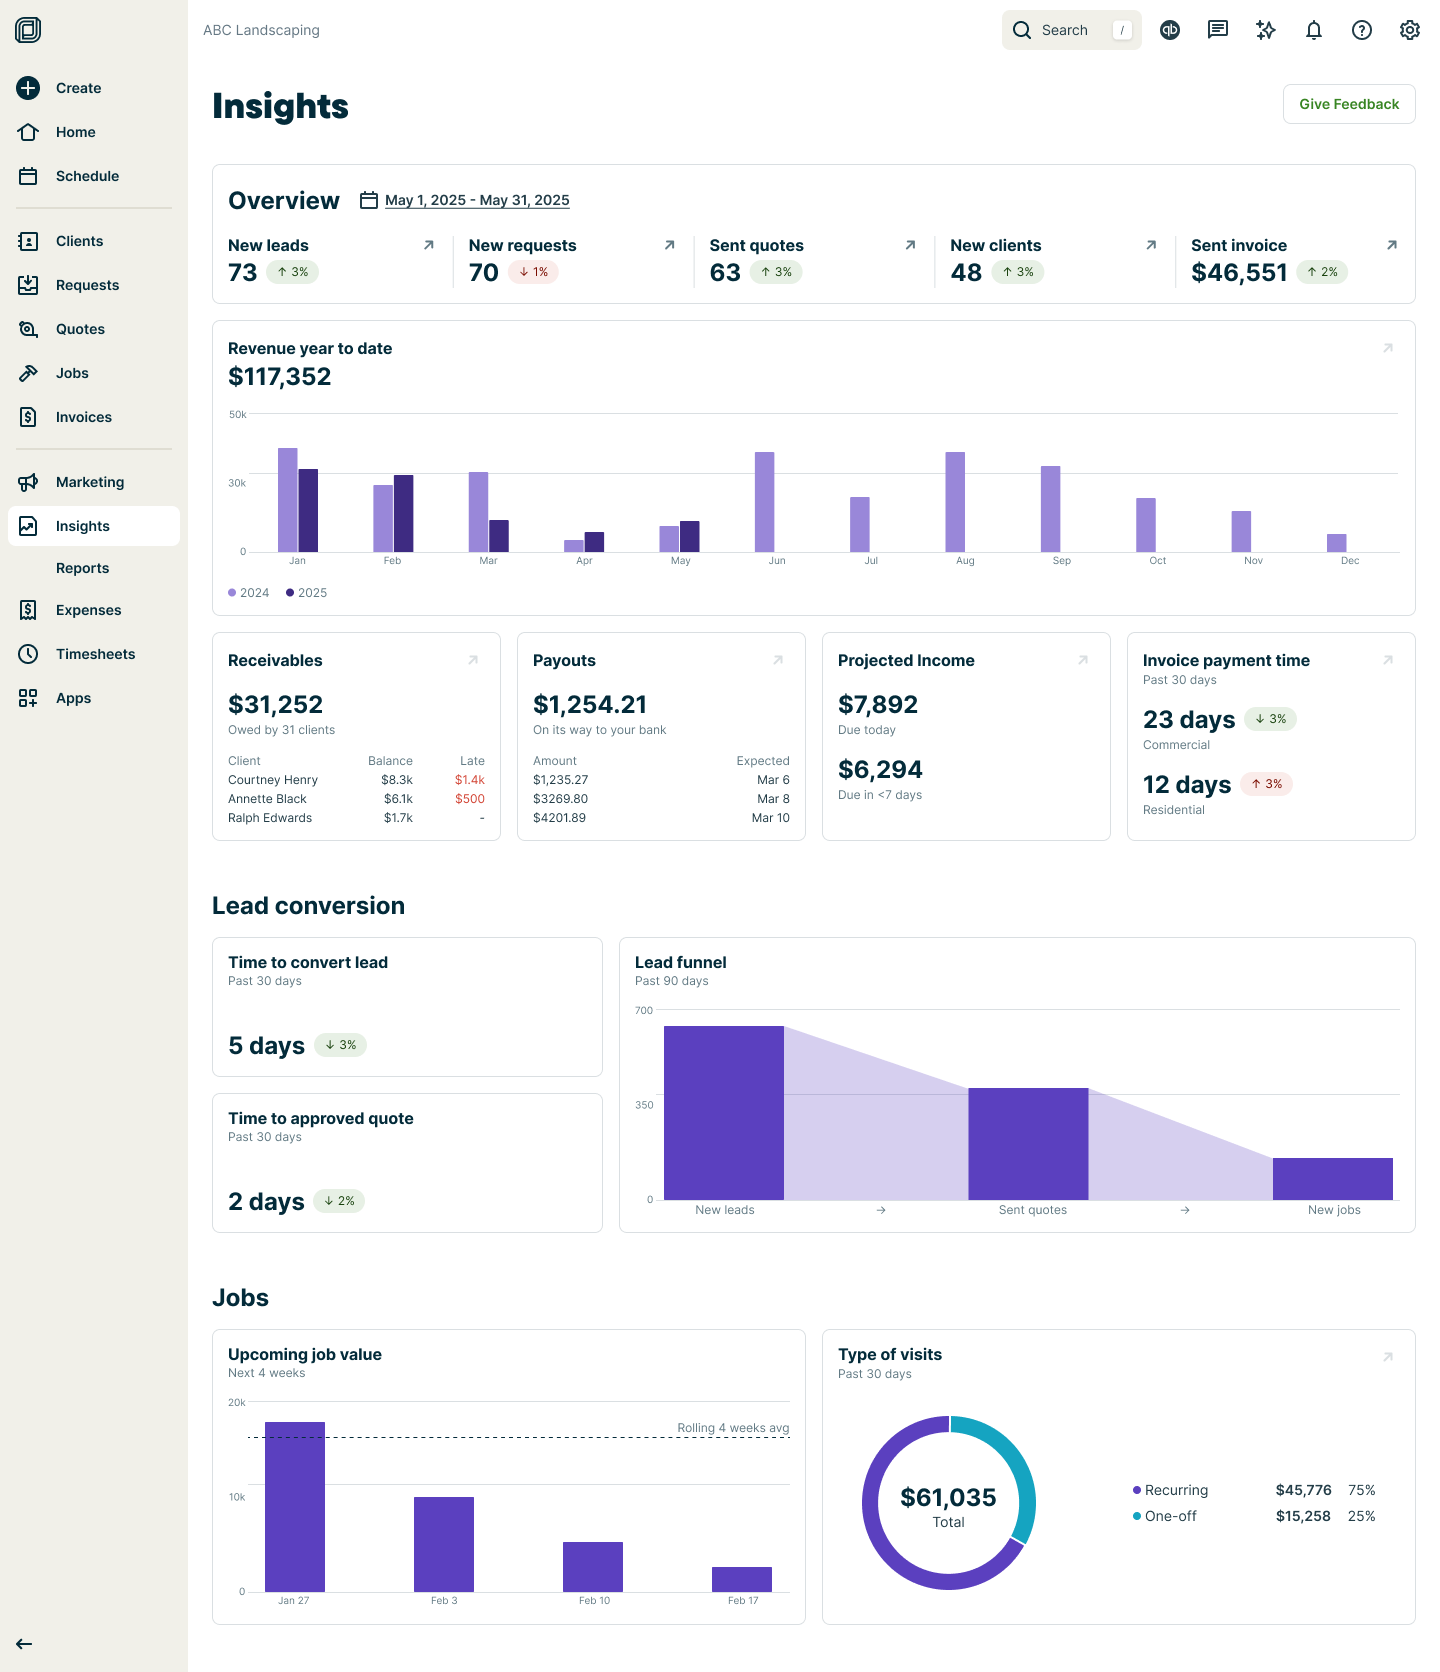
Overview insights
The overview section highlights key stages of work for the selected date range, including:
- New leads: This is the number of new leads
- New requests: This is the number of new requests
- Sent quotes: This is the number of quotes you’ve sent out
- New jobs: This is the number of new jobs created
- Sent invoices: This is the dollar value of invoices issued
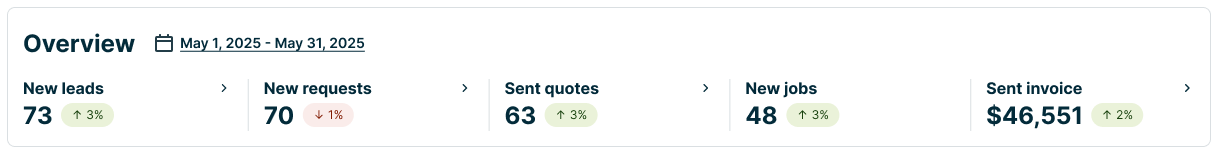
The date range for the overview section can be customized. To change the date range, click the dates then use the date picker to select your desired range: month to date, last month, or year to date.
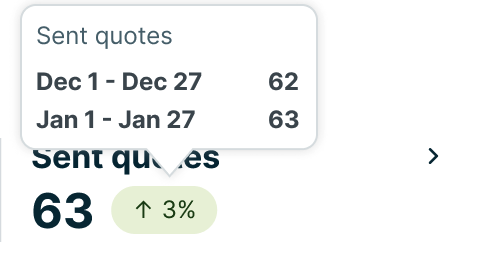
The trend indicator shows how the metric has changed compared to the previous period. Hover over the trend indicator to view the date range and the values for the current and previous period.
Revenue year to date
The revenue year to date section compares your revenue so far this year to the previous year, helping you identify trends and track growth over time.
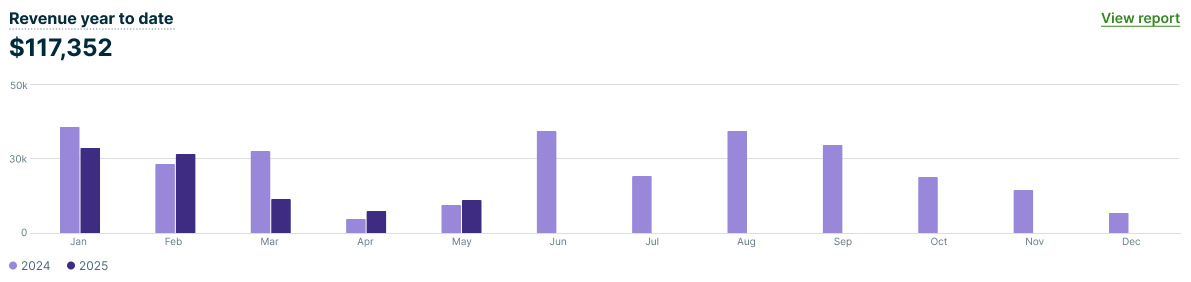
Revenue is calculated as the monthly value of sent invoices (after discounts and before tax) for both the current year and previous year.
At the top of the section is your total revenue for the current year so far.
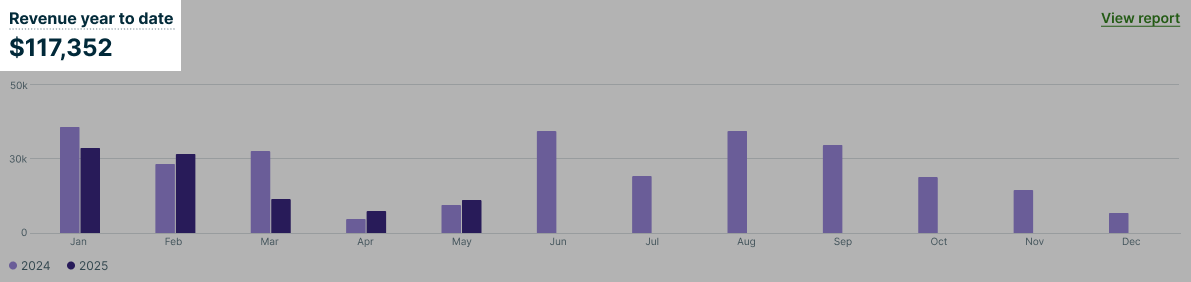
Select View report from the revenue year to date section to open the invoices report.
Learn more about the invoices report
Receivables
To help you stay on top of money owed, the receivables section shows outstanding balances owed to you by clients.
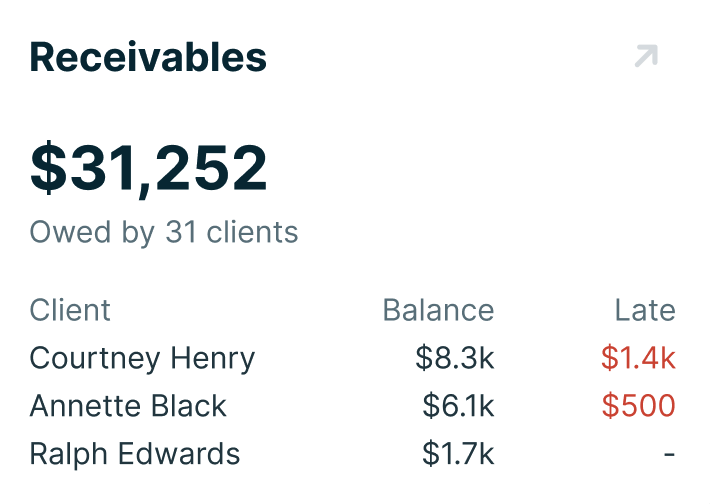
The receivables section shows the:
- Total number of clients with a balance owing
- Total outstanding balance
- Top 3 clients (based on account balance) owing and late payments
Select the arrow icon to open the client balance summary report.
Learn more about the
client balance summary report
Payouts
The payouts section displays the funds that are on the way to your bank through Jobber Payments. This section includes the value of the payouts on their way as well as the expected date they will arrive in your bank account.
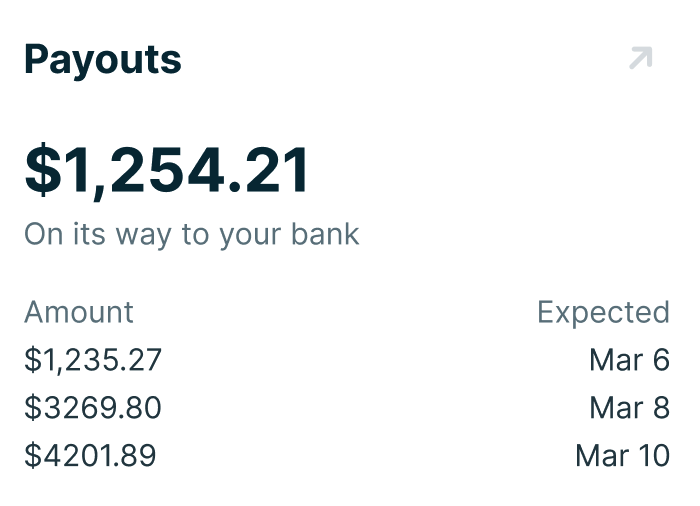
Select the arrow icon to open the Jobber Payments payouts report.
Learn more about the
Jobber Payments payouts report
Projected income
To give you an idea of the money that will be coming in, the projected income section of the insights dashboard displays the value of invoices due within the next 7 days (including today).
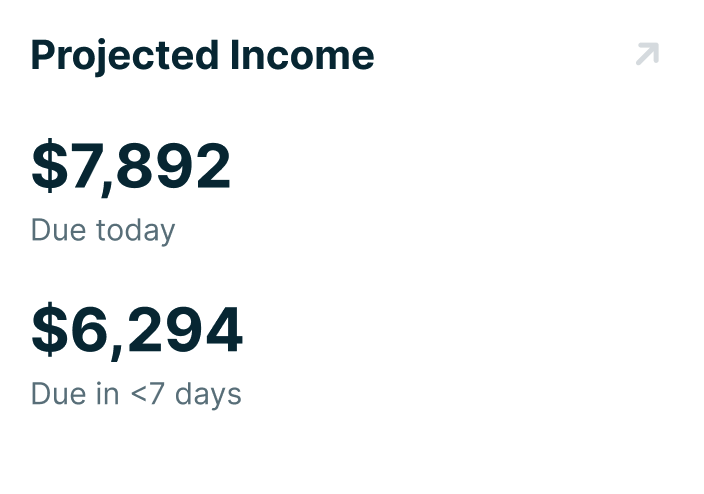
Select the arrow icon to open the projected income report.
Learn more about the
projected income report
Invoice payment time
The invoice payment time metric calculates how long, on average, it takes for invoices to be paid. This is determined using invoices with a paid date within the last 30 days.
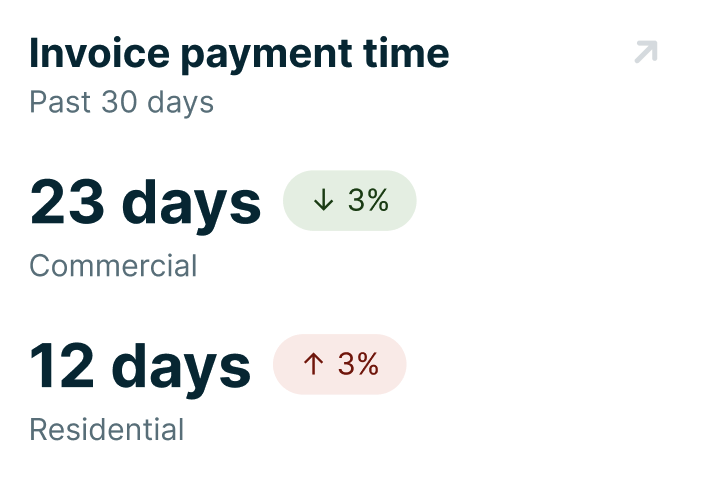
The average time to get paid calculation follows this formula: (Paid Date - Issued Date) ÷ Number of Invoices.
To provide more detailed insights, this metric is separated into residential and commercial values. An invoice is categorized as commercial if the client has the “Company name is primary name” setting enabled.
There are trend indicators for the average time to get paid for both commercial and residential clients. Hover over the indicator to see a breakdown comparing the last 30 days to the previous 30-day period.
Select the arrow icon to open the invoices report.
Learn more about the invoices report
Lead conversion
The lead conversion section of the insights dashboard includes:
Lead conversion time
The lead conversion time metric measures how long it takes, on average, to turn a lead into a client. This is calculated using all clients with a conversion date within the past 30 days.
Leads are considered clients once they have:
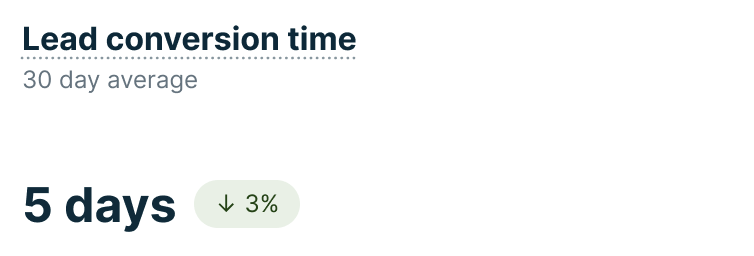
The calculation for time to convert lead follows this formula: Average of (Client Conversion Date - Lead Creation Date).
The final value is rounded to the nearest whole day. This metric helps you track how efficiently leads are moving through your sales process.
The time to convert lead section also shows a trend indicator of the previous 30-day period. Hover over the indicator to see a breakdown comparing the last 30 days to the previous 30-day period.
Quote approval time
The quote approval time section displays the average time for a quote to be approved or converted to a job within the last 30 days.

There is a trend indicator to show how the time to approved quote compares to the the previous 30-day period. Hover over the indicator to see a breakdown comparing the last 30 days to the previous 30-day period.
Lead funnel
The lead funnel visualization illustrates how efficiently leads are converted into sent quotes and new jobs over the past 90 days, providing a clear funnel view of the process.
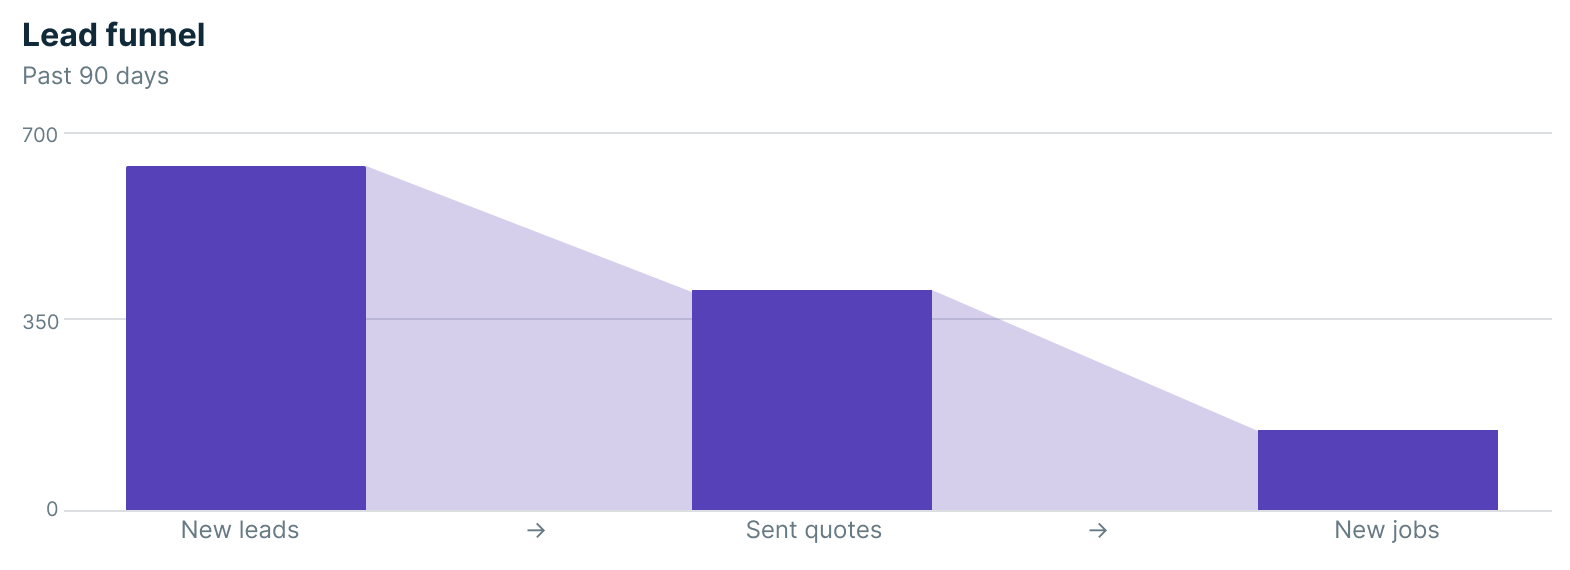
The funnel is calculated as follows:
- New Leads: The total number of new leads created in the last 90 days.
- Leads with a Sent Quote: The number of these leads that have at least one sent quote (this counts the number of leads, not the total number of sent quotes).
- Leads with a Created Job: The number of these leads that have resulted in at least one job being created.
Jobs
The jobs section of the insights dashboard includes:
Scheduled job value
The upcoming job value section shows the total value of scheduled work for the next four weeks, helping you understand how much revenue is booked and how it compares to your average weekly bookings. This provides insight into how booked out your business is and helps with planning and forecasting.
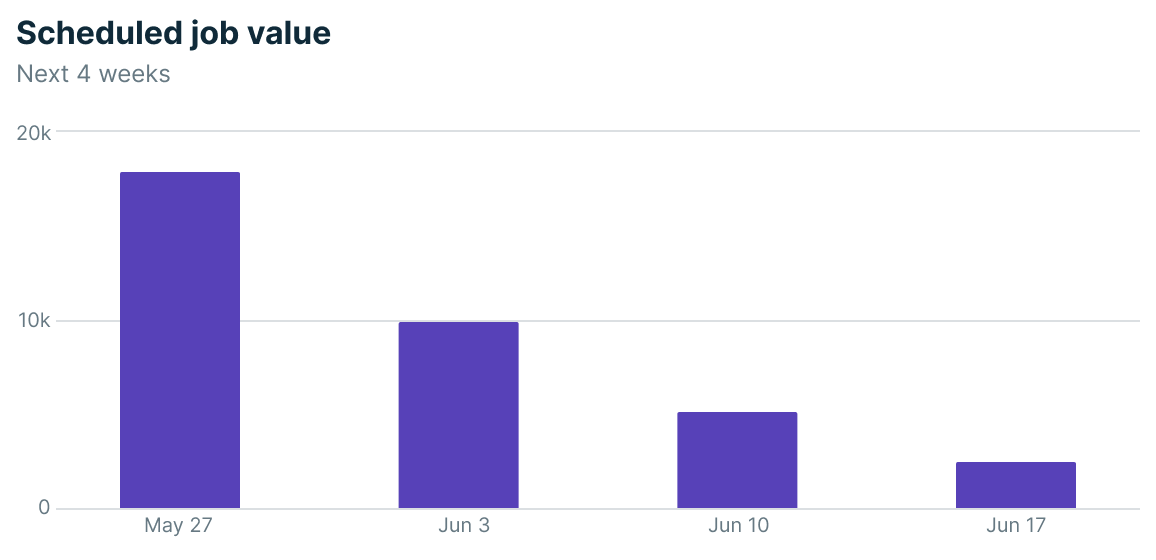
Scheduled job value is calculated based on:
- The value is based on the start date of each visit.
- The total job value is pre-tax and pre-discount.
- Includes:
- One-off jobs
- Recurring jobs with per-visit billing (based on visit dates)
- Recurring jobs with fixed-price billing (based on invoice reminder dates)
- For comparison, the dashboard also displays the average weekly job value from the previous four weeks.
Recurring vs one-off
The recurring vs one-off section shows a visualization of the ratio of your one-off and recurring job types.
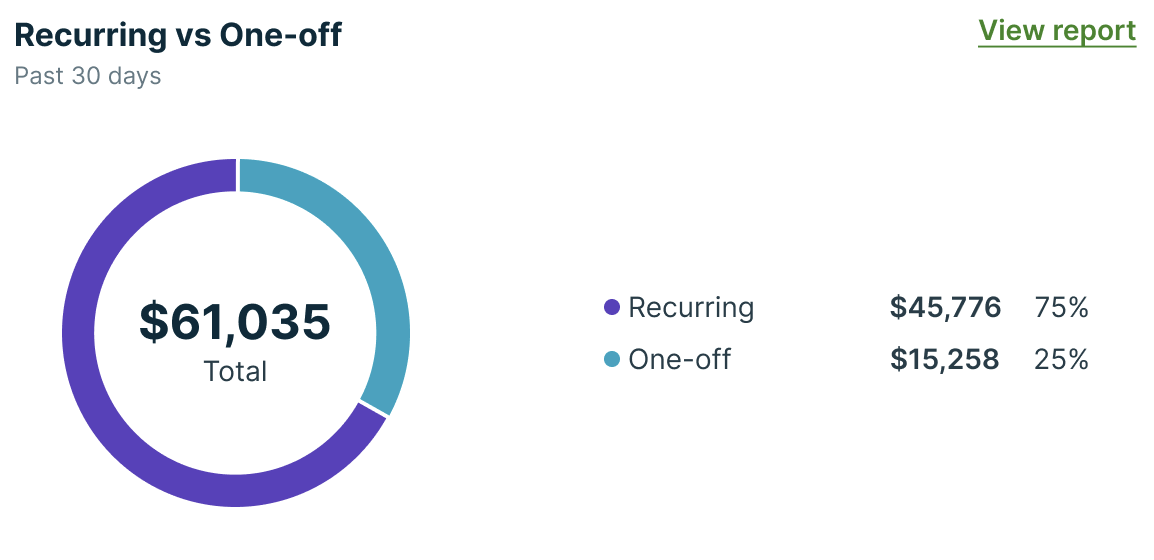
The type of visits are calculated by:
- Number and value of visits belonging to one-off jobs (based on visit start date)
- Number and value of visits belonging to recurring jobs (based on visit start date)
- Percentage ratio of one-off vs. recurring jobs
From the type of visits section, select View report to view the visits report.